The easiest way to create professional financial reports in Excel
Series of numbers in seemingly endless tables are too little to be able to quickly gain insights and focus on the essentials.
Present data and your correlations so that decision-makers can draw the right conclusions quickly and reliably. They will thank you for it!
Are you curious?
We will be happy to answer all your questions in a video meeting and demonstrate "live" how intuitive and easy the add-in is to use.
Professional tables and charts with one click
Excel often has to put up with the criticism that the standard visualisation options are not "state of the art" on the one hand and complicated to create on the other.
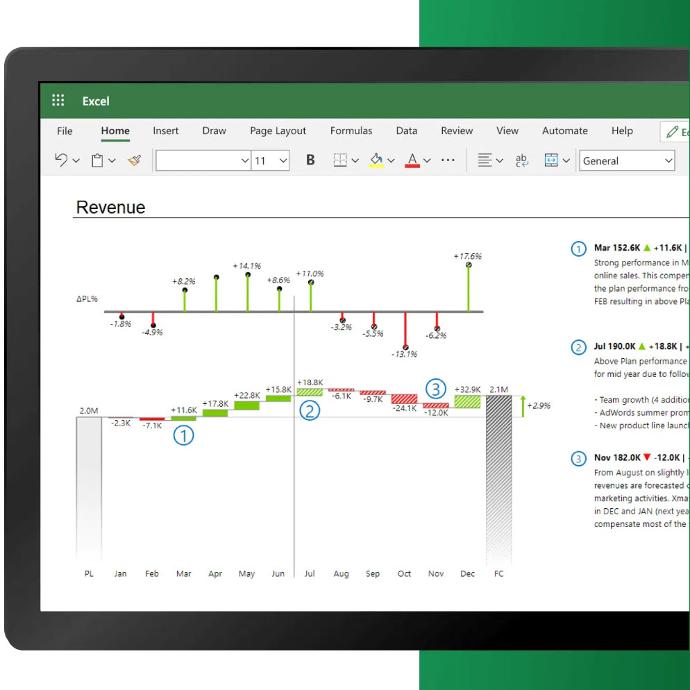
The add-in from our Slovenian partner Zebra-BI closes this gap impressively: It transforms bare figures - whether from fixed cell ranges, pivot tables or Excel spreadsheets - into professional business graphics - then switch between waterfall charts, variance analyses and other forms of visualisation.
Deviations are calculated and displayed out-of-the-box
To understand business contexts, it is essential to always look at numbers in context.
Don't just present your absolute sales figures, but compare them against previous periods and planned values.
And the best thing is: the Excel add-in calculates and visualises absolute and relative deviations completely automatically. If the columns are named accordingly (ACT, BUD, etc.), the add-in even recognises the mapping automatically.
Make a story out of your table or chart
Business graphs often serve as a decision-making tool for managers. Prepare the decision by annotating the significant values in your raw table.
The add-in does the rest: it labels and numbers the significant values and adds the comments as a legend.
Create stunning financial reports
Tables with endless rows of figures have had their day. With Zebra-BI you can create user-friendly and, above all, easily interpretable profit and loss statements, balance sheets, cash flow statements, price-quantity variance analyses, and much more. - 100% in Excel: with subtotals, invert functions for costs, calculable fields (e.g. DB in %), automatic deviation charts to plan and previous period values, and much more.
Further features and highlights
IBCS conform
Zebra-BI is 100% compliant with IBCS (International Business Communication Standards).
Data security
The add-in does not save any data, this remains 100% in Excel - the add-in is solely responsible for visualisation.
certified partner
The add-in manufacturer Zebra-BI is both IBCS certified and Microsoft certified.
Responsive design
Charts and tables automatically adjust to the size of the object - for example, relative and absolute deviations automatically appear as sub-charts as soon as you drag the object to the appropriate size.
Version-independent
The add-in works in any Excel - whether on the desktop, in Excel Online or on the Mac.
Simple set up
The installation/set-up is done directly in Excel - all you need to do is add 2 add-ins from the Market Place - that's all, whether you use Zebra-BI for Excel as an individual or company-wide.
Pricing
All users - whether report creators or report recipients - require a licence. This is issued for a domain and covers a certain number of users.
All plans are billed annually, but can be cancelled monthly. The remaining amount is then refunded on a pro rata basis. Invoicing is always done directly with the software manufacturer Zebra-BI, but can also be done by us if required. Services (e.g. training, consulting) are always provided and invoiced by us.
Free
€ 70.00
- 1 User
- free of charge for an unlimited period
- Start your free plan *
- * You will be redirected to the Zebra BI page.
Starter
€ 58.00
per month, annual billing- up to 200 users included
- Standard support by Zebra BI
- Zebra BI branding removed
Advanced
€ 470.00
per month, annual billing- up to 50 users included
- Contains Powerpoint add-ins in addition to Excel add-ins (analogue functionality)
- Standard support by Zebra BI
- Zebra BI branding removed
Enterprise
individual
Offer
- Unlimited number of users
- Dedicated Account Manager on the part of Zebra-BI
- Corporate Branding
- Training & Onboarding
Do you want a quote or to order right away?
Tell us your data and your request and we will send you an offer immediately.
Do you have any further questions?
We will be happy to answer all your questions in a video meeting and demonstrate "live" how intuitive and easy the add-in is to use.